Continuously monitor Microsoft, Oracle, Linux and Java based applications and services to assure optimal service levels to your users. Reduce IT workloads with pre-defined monitors ranging from SharePoint and Exchange through IIS and SQL.
Features:
Monitor Commercial Applications
Turnkey application profiles let you easily monitor availability performance of Linux systems, Apache web servers (Linux or Microsoft based), popular Microsoft applications such as Exchange, SharePoint, Dynamics, Lync, SQL Server, DNS, Internet Information Services (IIS), Active Directory, and Hyper-V.
Monitor In-House Applications
Quickly generate custom application profiles and modify existing profiles to meet your specific monitoring needs with an intuitive profile development utility. WhatsUp Gold discovers and presents a menu of all services and processes available on a target server.
Monitor End-User Performance & SLA Compliance
Deliver the performance demanded by your users and meet the SLAs imposed by your business owners. Receive early warning when users are experiencing poor response times. Measure end-to-end response times using Progress iMacros and iDrone software extensions to create monitoring scripts to run anywhere in your network.
Advanced State Monitoring
Control the definition and monitoring of application states and how SLAs are calculated to eliminates false indictments on SLA failures. Configure multiple application states – up, warning, down, maintenance, and unknown and set threshold values for each.
Action Policies and Alerting
When a monitored component or application changes its state, you can create multi-step Action Policies. Action Policies can include issuing alerts via text or email, capturing events to a log file, or self-healing actions such as re-starting an application service or initiating a PowerShell script.
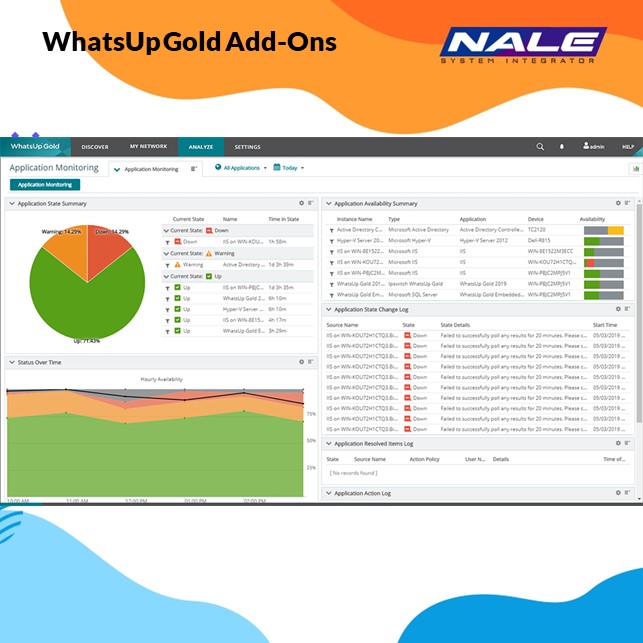
Leverage an Application Performance Monitoring Dashboard designed to help quickly identify the root cause of problems and identify trends that can affect future performance.
- Assess the health of all applications with the Current Status Dashboard, then select an application for drill-down analysis.
- Leverage Historical Status Reports to drill down and analyze application performance problems over a period of time and identify difficult-to- diagnose, intermittent performance problems such as memory leaks and URI cache failures.
- Diagnose chronic problems with our Component Summary Dashboard that details all monitored components for an application, including the percentage of time spent in different states.
- The State Change Log keeps a running tally of all state changes at the application and component level to anticipate potential problems.

